
Your automated red teaming program just reported a clean bill of health.
Every simulated kill chain was detected. Every lateral movement attempt triggered an alert. The board sees improving KPIs.
None of it accounts for the 30% of your environment that produces no alerts at all, because your SIEM never ingested those log sources in the first place. The confidence is real. The coverage is not.
Adversaries have adopted agentic tooling that scales campaigns and compresses dwell time. Manual pentests on quarterly cycles cannot keep pace. But the conversation about automation has fixated on testing methodology while ignoring the data foundation that determines whether test results mean anything.
Walk us through your current SIEM coverage and we'll show you where the blind spots live in stacks like yours.
Automated red teaming uses software agents to continuously simulate adversarial tactics, techniques, and procedures against an organization's environment. Where annual or quarterly penetration tests provide depth at a single point in time, automated programs run ongoing simulations at a cadence that matches how fast environments change and attackers adapt.
Four categories occupy this space, and procurement conversations routinely conflate them.
| Category | What it does | Best fit |
|---|---|---|
| Traditional pentesting | Human-led, scoped, point-in-time. Two to four weeks per engagement. | Compliance evidence and targeted assessment. |
| Breach and Attack Simulation (BAS) | Replays predefined attack scenarios against detection logic. | Validating that known detection rules fire. |
| Continuous Automated Red Teaming (CART) | Ongoing autonomous simulation aligned to MITRE ATT&CK. | Discovering attack paths regardless of whether detections exist for them. |
| Automated Progressive Red Teaming (APRT) | Adapts strategies across cycles using intention-expanding modules. | Testing LLMs against prompt injection and multi-turn jailbreaks. |
BAS tells you whether your existing detections fire. CART tells you what attack paths exist regardless of whether you have detections written for them. Organizations running BAS alone are validating the rules they already wrote, not discovering the gaps they have not. APRT addresses the next category over: attack patterns scripted BAS tools were never designed to simulate. Both OWASP's Top 10 for LLMs and MITRE ATLAS treat these as first-class threats.
Automation wins on breadth. Human operators win on creativity.
2025 arXiv research found that automated red teaming achieves a 69.5% vulnerability discovery success rate versus 47.6% for manual testing alone, identifying 37% more unique vulnerabilities. Automated tools follow programmatic playbooks. They cannot replicate the context-dependent attack chains a skilled operator constructs by reading an environment's specific topology. A human tester notices that a service account has overly broad permissions and pivots the engagement around it. Automation tests whether the known TTPs work.
The cost of running manual-only programs is compounding, not stable. Only 26% of organizations conduct proactive security testing specific to AI systems, while 97% have already experienced GenAI-related security incidents. Multi-agent denial-of-service attacks succeeded in over 80% of tests in ACL 2025 research. Quarterly manual pentests cannot keep pace with adversaries who have no scheduling constraints, and the gap compounds with every quarter teams stay on that schedule.
That cadence is widening the gap. See what continuous detection validation with agents looks like.
Two structural factors determine what CART can reliably find. Log coverage completeness is the first. The data architecture underneath it is the second.
IDC research shows the average enterprise monitors only two-thirds of its environment. A CART program running against a SIEM that covers 60-70% of the environment produces confident findings about a fraction of the actual attack surface. The remaining 30-40% is invisible. No alerts, no CART findings, no remediation.
The log sources that get cut first are the ones attackers exploit most:
When a CART platform reports “no exploitable path found,” that finding is only as trustworthy as the log coverage underneath it. No CART vendor has an incentive to tell you this.
The detection gap is invisible unless it is measured directly. Findings count, mean time to detect, and high-severity remediation rates do not reveal whether the underlying log environment is complete. A program can report steadily improving KPIs while an entire cloud environment, OT segment, or SaaS layer remains structurally invisible.
The diagnostic question that changes the meaning of every red team report: what percentage of our log sources are currently monitored, and how was that percentage determined? Most SIEM teams will struggle to answer with precision. That struggle is the problem. Strike48 covers why this baseline matters in its security log management breakdown.
Legacy SIEMs require teams to make parsing decisions at ingestion time: which log sources to parse, normalize, and retain. The cost penalty for indexing every source is prohibitive, so teams make budget-driven exclusions that create structural blind spots. A red teaming program layered over this infrastructure validates detection logic against a subset of the real attack surface.
Federated search, also called search-in-place, decouples storage decisions from upfront parsing. Logs stay where they originate, in the cheapest storage available. Parsing applies only when a query runs against that data. Organizations achieve complete log coverage at a fraction of traditional SIEM cost because they no longer pay to parse and re-index every source at ingestion.
Immediate log access also means agents validate detection logic against new log sources without waiting for schema definition and pipeline cycles. A cloud workload spins up. Logs become queryable through Strike48 immediately. CART validation runs today, not after six weeks of engineering.
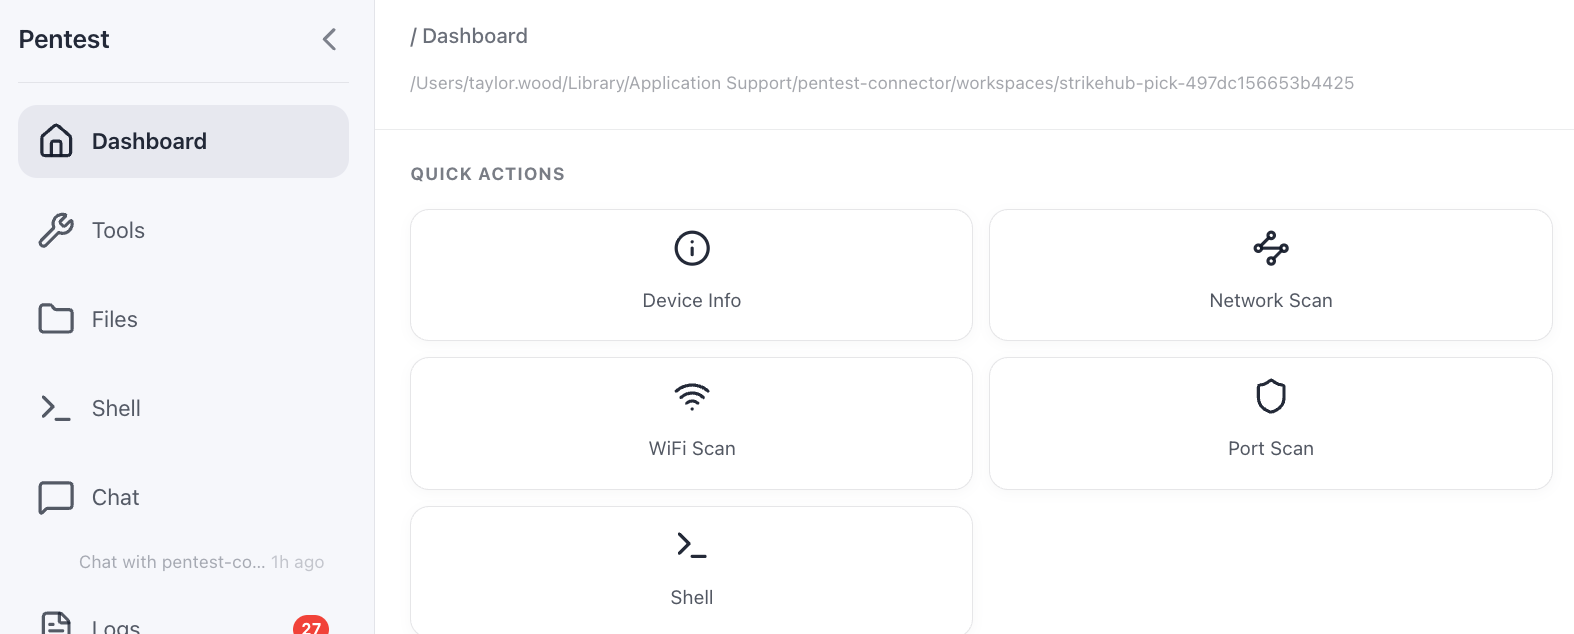
Strike48 closes the loop from attack simulation to detection validation. Strike48 Pick, the open-source reconnaissance agent, runs inside target environments and covers port scanning, device enumeration, WiFi discovery, ARP analysis, and PCAP collection from a single binary. Reconnaissance data feeds directly into the AI layer, where micro-agents correlate findings against log data across every connected source. The reconnaissance finds the surface, search-in-place makes the data available, and agents correlate what red teaming found against what the detection infrastructure actually observed.
| Metric | Target | Why It Matters | Red Flag |
|---|---|---|---|
| Mean time to detect simulated attacks (MTTD) | Under 8 minutes | Measures how fast detection logic fires against known TTPs; Strike48 early deployments achieved this benchmark. | MTTD improving while coverage percentage stays flat (faster detection over the same partial environment). |
| High-severity undetected findings | Declining trend over rolling 90-day periods | Measures whether detection engineering is closing the gaps that CART exercises surface. | Flat or rising trend despite an active CART program (detection engineering is not keeping pace with findings). |
| Detection coverage percentage | Measured against the log-coverage baseline from step one | Determines whether the first two metrics are meaningful; a 95% detection rate over 60% of the environment is a 57% actual detection rate. | No formal measurement exists (every other metric is unbounded). |
| Regulatory Driver | Impact | 2026 Status |
|---|---|---|
| EU AI Act (fully enforced August 2026) | Fines up to €35 million for failure to conduct adversarial testing on high-risk AI models. | "High-risk" scope covers AI in hiring, credit scoring, critical infrastructure, and law enforcement. |
| Healthcare red teaming adoption | Jumped from 21% in 2021 to 62% in 2026. | When a historically conservative sector triples adoption in five years, the practice is shifting from best practice to minimum standard. |
| AI attack surface expansion | Prompt injection in 70% of LLM audits; multi-turn jailbreaks at 97% success within five turns; 250 poisoned documents can compromise an LLM. | Organizations deploying LLMs without adversarial testing are shipping to attackers who have already tooled for these vectors. |
| Cost asymmetry | A single prompt injection attack can exceed $100,000 in losses; CART engagements average $16,000. | Structured programs documented $2.4 million in breach-cost avoidance and a 67% incident reduction; AI-mature organizations see 60% fewer AI-related incidents. |
Automated red teaming is a data foundation problem first and a testing methodology problem second. The same constraint binds every CART program, every BAS playbook, and every manual pentest. The attack paths they find exist only in the portion of the environment that generates observable signals. Fix the visibility, and you fix what red teaming can reliably validate. Strike48's approach to building this foundation starts with the agentic security architecture that makes complete visibility the prerequisite for agent deployment.
The intelligence is already in your logs. Strike48 gives agents the visibility to find attack paths and the completeness to trust that what they do not find is genuinely absent, not hidden behind a coverage gap.
If your CART program is reporting confidence you cannot verify against the full attack surface, it is testing what is convenient to monitor, not what adversaries are actually targeting.
That gap is what Strike48 closes. Run detection validation against every log source.
Surface the attack paths your current SIEM has been quietly excluding.
Penetration testing is human-led, scoped, and point-in-time, conducted annually or quarterly for compliance evidence. Automated red teaming uses software to simulate attacks continuously, running kill-chain scenarios across the environment without requiring a human operator on each exercise. The key distinction is cadence: pentesting tests a moment in time, automated red teaming tests a state that changes daily.
CART is a category of automated red teaming defined by ongoing, autonomous adversarial simulation aligned to frameworks like MITRE ATT&CK. Unlike scripted BAS tools that replay predefined scenarios, CART platforms run continuously and simulate a broad range of TTPs without manual scheduling. CART catches the attack paths that open between quarterly manual exercises.
CART programs are bounded by the same log visibility constraint as everything else in the SOC. The average enterprise monitors roughly two-thirds of its environment, so a CART program running against a standard SIEM tests approximately 70% of the attack surface. Strike48's federated search architecture addresses this by making 100% log coverage economically viable, so CART validation runs against the full environment.
Three metrics matter when tracked together: mean time to detect simulated attacks (target under eight minutes), reduction in high-severity undetected findings over rolling 90-day periods, and detection coverage percentage. The third is the one most programs do not track and the one that determines whether the first two are meaningful.